ER Model vs. UML diagram
ER model
What is the ER model?
The full-form of ER model is Entity-Relationship model. It is a model which is used to
describe the relationship between data-elements in a database system. This ER model is
generally portrayed using an ER diagram. It is widely used in various organizations as it is
really simple and easy to understand, with just a glance a person can understand each and
every aspect of the backend architecture.
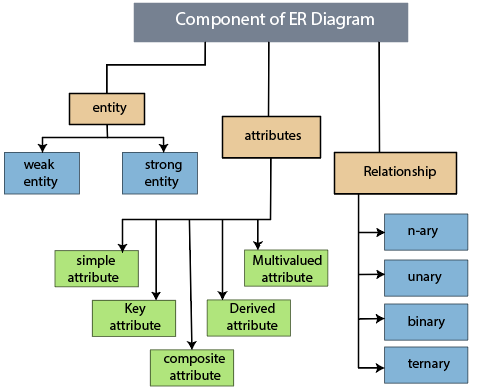
Components of ER model
Entity:
- An entity can be anything ranging from a person, place or object. It is generally represented using a rectangle. For example, faculty, student, department, college all can be termed as entities.Weak Entity: An entity which depends on another entity is called a weak entity. It
represented with double-rectangle and does not have a key attribute of its own
Attribute:
- The attribute is used to describe the property of an attribute. It is described using an oval.
a. Key Attribute: It is used to describe the most important attribute of an entity
i.e its primary key. It is described using oval and text inside it is underlined.
b. Composite Attribute: It is the attribute of an attribute i.e the nested attribute.
It is usually a chain of oval connected to each other with a line.
c. Multi-valued Attribute: It is the kind of attribute which can have multiple values.
It is generally represented using a double oval.
d. Derived attribute: The attribute which can be derived from other attribute can be
called as derived attribute. It is represented using dashed oval.
i.e its primary key. It is described using oval and text inside it is underlined.
b. Composite Attribute: It is the attribute of an attribute i.e the nested attribute.
It is usually a chain of oval connected to each other with a line.
c. Multi-valued Attribute: It is the kind of attribute which can have multiple values.
It is generally represented using a double oval.
d. Derived attribute: The attribute which can be derived from other attribute can be
Relationship:
- A relationship is used to describe the relation between different entities. It is generally represented using rhombus or diamond.
One-to-one relationship:
When only one instance of an entity is connected to its relationship,
then it is called a one-to-one relationship.
One-to-many relationship:
When there is only one entity present on the left and instance of more than
one entity on the right then it is called a one-to-many relationship.
Many-to-one relationship:
When an instance of more than one entity is on the left and only one entity is
present on the right then it can be called a many-to-one relationship.
Many-to-many relationship:
When the instance of more than one entity binds with instance of more than one
instance entity then the relationship can be termed as many-to-many
relationship.
One-to-one relationship:
One-to-many relationship:
Many-to-one relationship:
Many-to-many relationship:
How to draw an ER diagram
Have a defined goal and purpose of drawing the ER diagram. It may be drawn for
business needs or for database creation.
Know the constraints and limitations of the system you are trying to build.
Draw major entities of the system.
Investigate the several properties involved in the entities.
Consider the relationship between several entities.
Use database normalization to restructure the data.
Have a defined goal and purpose of drawing the ER diagram. It may be drawn for
Know the constraints and limitations of the system you are trying to build.
Draw major entities of the system.
Investigate the several properties involved in the entities.
Consider the relationship between several entities.
Use database normalization to restructure the data.
Limitations of ER diagram
Can only be used for relational data.
No industry standard as everyone has their own idea of developing an ER model.
Some data may be lost in abstraction of concepts.
Can only be used for relational data.
No industry standard as everyone has their own idea of developing an ER model.
Some data may be lost in abstraction of concepts.
UML Diagram
UML is a way of visualizing software programs using a collection of diagrams. It is called as
Unified Modeling Language.
What is UML?
UML is known as Unified Modeling Language. UML 2.0 helps to extend the original UML specification
to cover a wider portion of software development including agile practices.
Types of UML Diagrams
The current UML has almost 13 different types of diagrams:communication, composite structure, timing,
deployment , class, activity, object, use case, sequence, package, state, component and interaction
overview.
These all diagrams are organized into two main distinct groups,
1. Structural diagrams and
2. Behavioral or interaction diagrams

Structural UML diagrams:
- Class diagram
- Package diagram
- Object diagram
- Component diagram
- Composite structure diagram
- Deployment diagram
Behavioral UML diagrams:
- Activity diagram
- Sequence diagram
- Use case diagram
- State diagram
- Communication diagram
- Interaction overview diagram
- Timing diagram
Structural diagram:
UML Structural diagrams represent the elements of a system that are independent of time and that conduct the concepts of a system and how they relate to each other. In these diagrams the elements resemble a natural language, and the relationships connecting them are structural or semantic relationship.For example, a structural diagram of a vehicle reservation system might contain elements such as Car, Reservation, Driver’s License and Credit Card, and connectors linking these elements. Experienced modelers are also shows relationships to the Behavioral elements on these diagrams.
Behavioral diagram:
UML Behavioral diagrams specify, construct, visualize, specify, construct and document the
dynamic aspects of a system.
Class Diagram:
Class diagram is the main building block of any object-oriented solution. It shows the classes in a system, attributes, and operations of each class and the relationship between every class.In most of the modeling tools, basically the class has three parts. Name is at the top, attributes in the middle and operations or methods at the bottom of it. In the large system with many related classes, these classes are grouped together to create class diagrams. Different relationships between these classes are shown by different types of arrows.
Component Diagram:
A component diagram which displays the structural relationship of components of a software
system. These are mostly Commonly used when working with complex systems with many
components. These Components communicate with each other using interfaces. The interfaces are linked using connectors.Deployment Diagram:A deployment diagram is a diagram that which shows the hardware of your system and the
software which is present in that hardware. Deployment diagrams are more useful when your
software solution is deployed across multiple machines with each of them having a unique
configuration.Object DiagramIt sometimes these are referred to as Instance diagrams, which are very similar to class
diagramsLike every class diagram, they also show the relationship between the objects but they use
real-world examples.They show what the system will look like at a given time. Because
there is availability of data in the objects, they are used to explain complex relationships
between objects.
Composite Structure Diagram
Composite structure plates it used to show the internal structure of a class, And some of the
common compound Structure Diagram. Profile Diagram PD is a new illustration type which is introduced in UML 2. This illustration type is veritably
infrequently used in any specification. Package Diagram
The Package Diagram shows dependences between different packages in a system.Exertion Diagram The exertion plates are represent workflows in a graphical way. It can be used to describe the
business workflow of any element in a system. Some times exertion illustration are used as a
violation to State machine plates.
Use Case Diagram
The UCD is the most important illustration type in the Behavioral UML types, It uses case
illustration it principally give an graphic overview of the actors involved in a system, some
of this different functions demanded by those actors and how these different functions
interact with UCD.State Machine Diagram
The State Machine Diagram is analogous to exertion plates, although sundries
beach operation change a bit. They're occasionally known as state map illustration. These are
really veritably useful illustration to describe the geste of objects which acts else according
to the state which they're in the state.
dynamic aspects of a system.
system. These are mostly Commonly used when working with complex systems with many
components. These Components communicate with each other using interfaces. The interfaces are linked using connectors.
software which is present in that hardware. Deployment diagrams are more useful when your
software solution is deployed across multiple machines with each of them having a unique
configuration.
diagramsLike every class diagram, they also show the relationship between the objects but they use
real-world examples.They show what the system will look like at a given time. Because
there is availability of data in the objects, they are used to explain complex relationships
between objects.
Composite structure plates it used to show the internal structure of a class, And some of the
common compound Structure Diagram.
infrequently used in any specification.
The Package Diagram shows dependences between different packages in a system.
business workflow of any element in a system. Some times exertion illustration are used as a
violation to State machine plates.
illustration it principally give an graphic overview of the actors involved in a system, some
of this different functions demanded by those actors and how these different functions
interact with UCD.
beach operation change a bit. They're occasionally known as state map illustration. These are
really veritably useful illustration to describe the geste of objects which acts else according
to the state which they're in the state.
Timing Diagram
This Timing plates is veritably analogous to sequence plates. It represent the geste of objects in a given time frame. If it's an only one object also the illustration is straightforward. But, if there's further than one object involved, a Timing illustration is used to show relations between objects during that time frame.
Sequence Diagram
In UML Sequence Diagram show how objects interact with each other and the order those
relations do. It's important to note that it show the relations for a particular setivations. The
processes of sequence illustration represented vertically and relations are shown as arrows.
Differences between ER Model and UML Diagram
- ER Model stands for Entity-Relationship Model whereas UML stands for Unified Modelling Language
- ER Model consists of Entities, Relationships and their interactions whereas UML consists of work processes and use cases.
- ER Model is generally used by developers to understand the flow of program whereas UML diagram is generally used by Business owners and stakeholders to easily understand the software architecture
- ER Model is a static modelling where there are no states of it, whereas UML diagram implements dynamic modelling which depicts the activities and various states/cases involved in it.
- ER Model does not have any types but UML diagram consists of Structural and Behavioral type diagrams.
- ER Model is itself a representation of the architecture whereas UML diagram has various diagrams such as activity diagram, sequence diagram, use-case diagram etc.
Great👍🏻. Amazing and easy to understand.
ReplyDeleteInformative blog with high quality content
ReplyDelete